
So I recently went from zero to hero with my first ever topic modelling project. My topic model was by no mean perfect. But hey, with zero clue of what topic modelling even meant from the start, this is definitely a humble achievement of the week, okay?
I thought it would be amazing to explain how I did it, together with a few tips and tricks I have picked up along the way. Hopefully this post will be helpful for those who needs a tiny little bit of help before jumping into your first ever topic modelling project. So let’s start!
What is topic modelling?
Topic modelling is an unsupervised model that learns the set of underlying topics (in terms of word distributions) for a set of documents and each document’s affinities to these topics. Don’t fret if this means absolutely nothing to you. My previous blog post is here to help as I explained topic modelling in 5 minutes.
But… if you are really really lazy to read, that’s okay. Let me summarise it for you! In my own layman’s terms, when we aren’t sure what we are looking for, topic modelling can help to condense long chunks of text into concise words to understand the main ideas. It’s a quick and easy way to answer the question, “What are people talking about?”, from a novel, a tweet, an email or a random paragraph of text.
So how do you perform topic modelling?
The diagram below shows a quick summary of the steps I have done for topic modelling. The notebook and code can be found in my GitHub.
3 Top Tips for Topic Modelling
1st Tip: How to determine the most suitable/ optimal number of topics for LDA model
As academics and researchers are still on their quest to find the best approach to determine the optimal number of topics for LDA model, I can’t provide you with an exact number. However, the most common and simplest method is to try various number of topics and pick the number that gives you the highest coherence value. You might check out how I did it in my repository.
Do keep in mind that the purpose of topic modelling is to have a big picture view about what people are talking about. Assuming we are analysing text related to a specific industry or business, having thousands of topics could really hinder our understanding. Hence I truly believe less is more.
2nd Tip: How to interpret pyLDAvis chart
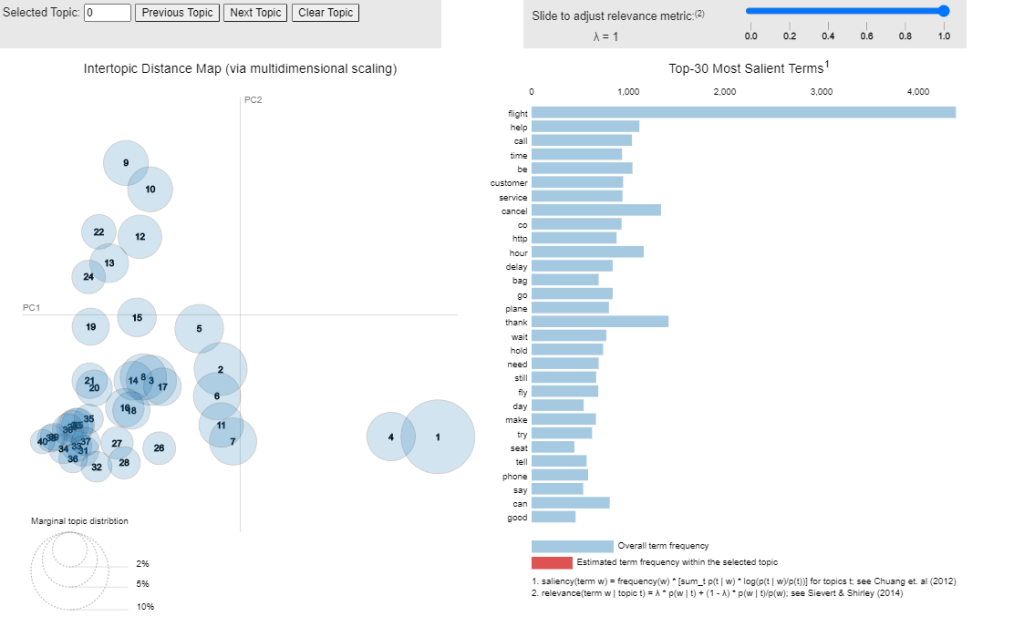
The pyLDAvis charts above help us to answer 3 basic questions about our topic model.
1. How prevalent is each topic?

Looking at the chart on the left (i.e. Intertopic Distance Map), each bubble represents one single topic and the size of the bubble represents the prevalence. Each bubble is also numbered from 1 to 40 according to decreasing order of prevalence. For example, topic 1 is the most commonly expressed across all tweets about 6 airlines.
2. How do the topics relate to each other?
Let’s look at the chart on the left one more time. The closer the bubbles, the more closely related the topics are. For example, topic 1 and 4 are closely related to each other owing to overlapping words.
3. What does each topic mean?

This time, we focus on the chart on the right. If we select a topic on the left, the chart on the right will show us the most useful words to understand what that topic is all about. For example, topic 1 could be interpreted as “flight cancellation” whereas topic 2 could be related to “change in reservation booking”.
3rd Tip: How to evaluate your LDA model (a.k.a how do you know whether your model is good enough?)
When I was working on this project, I knew a perfect model simply doesn’t exist. However, I found myself wondering whether my model is good enough and that made me search high and low for some sorts of metrics to evaluate LDA model. And I came across this article which offers detailed approach to evaluate topic models.
However, there are simpler ways to evaluate your LDA model without going too crazy with mathematics and algorithms. But do take my suggestions with a pinch of salt because these are shortcuts.
Method 1. Check the distribution of the bubbles on pyLDA charts.
The more non-overlapping and scattered the bubbles are, the better the model. If you found yourself with many tiny little bubbles overlapping and concentrating at one site, that means your topics aren’t so clear cut and easy to decipher what is going on. Perhaps it’s a good clue to review your number of topics or other parameters of the LDA model.
Method 2. Attempt to craft a story for a topic with related keywords
I would assume that you have decent knowledge about the context and the dataset before jumping into topic modelling. (And if you don’t, then please be gently reminded to do your due diligence as context means everything for data analysis.) One way to test the model out is to select a topic and read out loud those keywords. As soon as you read out loud, your mind should form a reasonable story which is appropriate to the context. For example, travelers complain about delayed flights. But if after going through many topics and the stories aren’t making sense, then your model might need a bit more tender love and care.
Admittedly, my first attempt with topic modelling is by no mean idyllic, especially when being confronted with technical jargons and countless error messages. But conquering a new concept has been always so rewarding for me personally. And what’s not to like when I have one more tool in my toolbox? So if you are feeling stuck with whatever things you are working on, don’t give up just yet. Soldier on and you will surprise yourself.
Till then, have a fabulous weekend everyone!
