How the project has taught me to start where I am, use what I have, do what I can to relentlessly drive it to completion
The Conjuring Universe: My 2-day Data Visualisation Project

Where I share my stories about business, technology and anything in between
How the project has taught me to start where I am, use what I have, do what I can to relentlessly drive it to completion
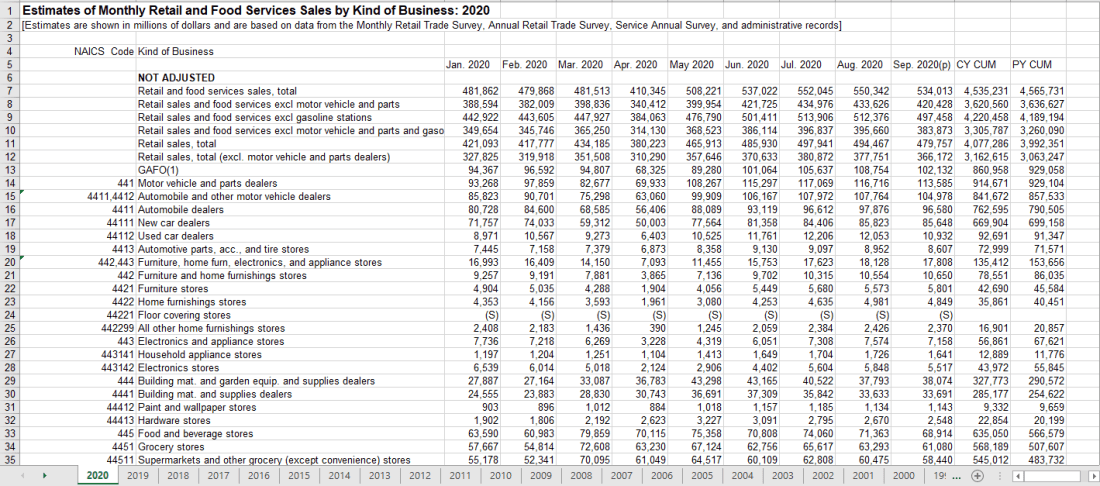
How to handle Excel data with multiple sheets and different levels of granularity

Who says financial statement has to always be in tabular format?

Introducing the history of tea via an interactive dashboard in Tableau

And how different components of Power BI Suite should be arranged to make each scenario work like a charm

A simple dashboard to track whether a company is on track to meet the sales target
